Using the Lobby-Level Conference Room Projector at PSHQ

MCP has updated the audio/visual setup in the PSHQ main conference room. Below is some information you may want.

Misc. Notes:

  • There is only one microphone in the room by default and it is located on the podium at the front of the room. If you know you will need more microphones, please contact Larry Kees (Larry.Kees@montgomerycountymd.gov), the POL Telecom Specialist. Please give him several days of lead time with your request.

Setting Up Your Laptop/Notebook

  • Place your laptop or notebook computer on the podium at the front of the room. Note the cords attached to the podium:
    • Blue cable: Network access
    • USB cable: Audio from your computer to the white speakers on the wall flanking the projector screen
    • HDMI cable: Video from your computer to the projector
  • Plug all three cords into your computer.

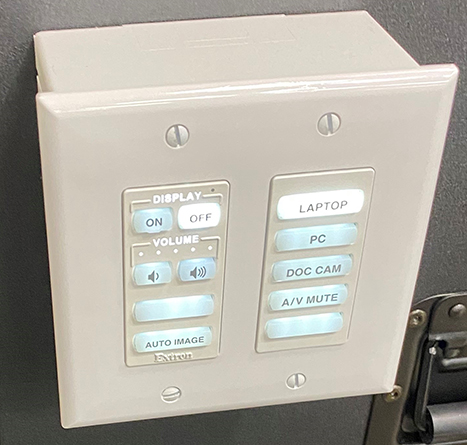
Using the A/V Control Box

  • Press the On button at the top-left corner of the A/V control box and ensure that the Laptop button is backlit, as well. When both buttons are backlit and your computer is on, the image from your computer should show on the screen.
  • Adjust the volume to the white speakers by pressing the two volume buttons.
  • Ignore all of the other buttons.

PSHQ Conf Room A/V Box

Docking Your eMEDS Toughbook (Quick Version)

Seat the Feet

Align the feet of the docking station with the notches on the bottom of the Toughbook.

IMG00007

Match A to A

Ensure that the A sticker on the Toughbook is in the same place as the A sticker on the docking station (bottom left side).

Match B to B

Guide the top of the Toughbook to the top part of the docking station slowly to match the B stickers on the Toughbook and the docking station.

IMG00008

Reporting for a Unit that Fails to Repond

Is a Fire App Unit Report completed for a unit that fails to respond? And if so, how is that report competed? In short, it depends.

  • If ECC marked the unit as FFR and the unit did not respond (i.e., no enroute time), then FireApp will not create a unit report for it and therefore there is no need to complete a FireApp report.
  • If ECC marked the unit as FFR and the unit did respond (i.e., with enroute time) after being marked as FFR, FireApp will create a unit report for it and the unit officer will have to complete that report.
  • If the unit was in fact FFR, but ECC failed to mark it as FFR, then FireApp will not treat it as FFR unit and went ahead to create a unit report for it. In this case, the commander can notify FRS IT and we will check with ECC. Once ECC confirms it is FFR, FRS IT will remove the unit report from FireApp and adjust FFR statistics for Ops Chief office accordingly.

Changing the Resolution on Your eMEDS Toughbook

The toughbooks offer two resolutions for you to choose. 800×600 will show the buttons and drop-down menu items as larger; 1024×768 will show those items as slightly smaller but will give you more to see on the screen without having to scroll. Here is a video that shows you how to change the resolution.

Note: Someone else may have already changed your Toughbook’s resolution and you only have the two from which to choose. Many thanks to Jason Giza for providing the video.

Printing the Battalion Line-Up from the DOC Log

Want to print the exported spreadsheet from the battalion line-up module of the DOC Log? The spreadsheet doesn’t work very well with default settings and so you’ll need to tweak a few things. Try this:

  • Click the Page Layout tab at the top of the screen.
  • Click on Margins (in the Page Setup section).  At the bottom of the menu that appears, choose Custom Margins.
    Custom Margins Option in Ribbon
  • Change the settings to:  Left: 0, Right: 0, Top: .5 and Bottom: .5
  • In that same window, click Center on Page Horizontally.

    Excel Margins for DOC Log Line-Up

  • Click the OK button.
  • While still in Page Layout tab, set Width to 1 page  and set Height to 1 page (in the Scale to Fit section).

    Custom Width and Height

  • Click the View tab.
  • Select Page Break Preview (toward the left side of the ribbon).  If a dialog box appears, click Do Not Show Again and then OK.
  • You will see a blue margin line on the far right side of the document.  Drag that blue line to the left, all the way to the edge of the document where the blue shaded text box ends.
  • Execute the Print command.

Note: To return to the previous view so that you do not see Page 1 written across the spreadsheet, select Normal, which is located next to Page Break Preview on the Page Layout tab.

Once you successfully print the first one, to print the additional battalions for your road pack, follow a similar process:

  • Click the Page Layout tab and click Margins.
  • Select Last Custom Setting (the first item in the list).
  • Set Width to 1 page and Height each to 1 page while still in Page Layout, as you did earlier (above).
  • Click the View tab and select Page Break Preview . You will see a blue margin line on the far right side of the document.  Drag that blue line to the left, all the way to the edge of the document where the blue shaded text box ends.
  • Execute the Print command.

Setting up Rules in Outlook 365

  • Log into Outlook and find a message for which you would like to create a rule.
  • Right-click the message in your inbox and select Create Rule from the pop-up list.

    Create Rule


  • Note the pop-up dialog box with basic options and choose More Options.

    Create Rule dialog box


  • Fill in your options for the boxes.

    Outlook Rule Options


  • Step 1: Name your rule. As you may create more rules over time, it is good to name this rule as something obvious to you so that you know what it does when you see it later.
  • Step 2: Add a condition. For the COVID e-mail reply-all mess that occurred on 03/26/2020, I recommend choosing Subject Includes from the drop-down list and then adding the words Working from home under COVID, as that was the subject used in most of the messages.
  • Step 3: Add an Action: Choose Delete. Feel free to add exceptions if you would like.
  • Click the Save button.

    Note: Since there are a considerable number of combinations as to what you might want to do with rules, this TechTip will not offer specifics beyond this point. If you need more assistance after you have experimented with creating your own rule(s), please contact Jeff Feiertag, IT Training Coordinator.

    Also: In the web version of Outlook, this will not delete existing messages. In the desktop version of Outlook, though, you will see a checkbox option to run the rule against the inbox, which would effectively delete the entire thread at once.

Finding the Right 800 MHz Radio Fleetmap

Looking for the right fleetmap? Please see the list below. Each link is a separate PDF, sized for an 8.5″ x 11″ sheet of paper. Please see below the list of links for a color-coded legend.

2024 Fleetmaps: 


Fleetmap Key

Creating a Chart Using Excel: Using the Quick Analysis Button

To Create a Chart in Excel Using the Quick Analysis Button:

  • Choose the data on the Excel worksheet that you want to include in your chart.
  • Choose the Quick Analysis icon.  A dialog box will appear on your screen.
  • Choose Charts option.
  • Preview the different types of charts by moving your  mouse over the various examples.  If you want to see more examples of charts, choose More Charts option.
  • Choose your chart layout from the options and click on it.  The chart will be inserted into your Excel worksheet.

Creating a Chart Using Excel: Using the Ribbon

To Create a Chart in Excel Using the Ribbon:

  • Choose the data on the Excel worksheet that you want to include in your chart.
  • Choose the Insert tab on the Ribbon.
  • Choose Recommended Charts on the Ribbon under the Insert tab.  An Insert Chart dialog box will display on your screen.
  • Choose a chart from the Recommended Charts or choose All Charts to see the entire library of charts.
  • Choose OK.  A chart will be created and placed in your Excel worksheet.  A Chart Tool tab will also appear on your Ribbon.
    • The Chart Tool tab will allow you to add options to your chart including titles, apply filters, or change the look of your chart.

Using AutoSum to Total Cells Using Excel

To Use AutoSum to Total Cells:

  • Choose the cell where you would like to display the total.
  • Choose the Formulas tab on the Ribbon.
  • Choose the AutoSum option on the Ribbon under the Formulas tab.  AutoSum will determine the formula to total the appropriate cells.
  • Hit the Enter key on your keyboard or click on the Checkmark to use AutoSum to calculate the totals.  The total will display in the cell you choose in the first step.